Linear Weighted Multi-Factor Model (Non-Machine-Learning)
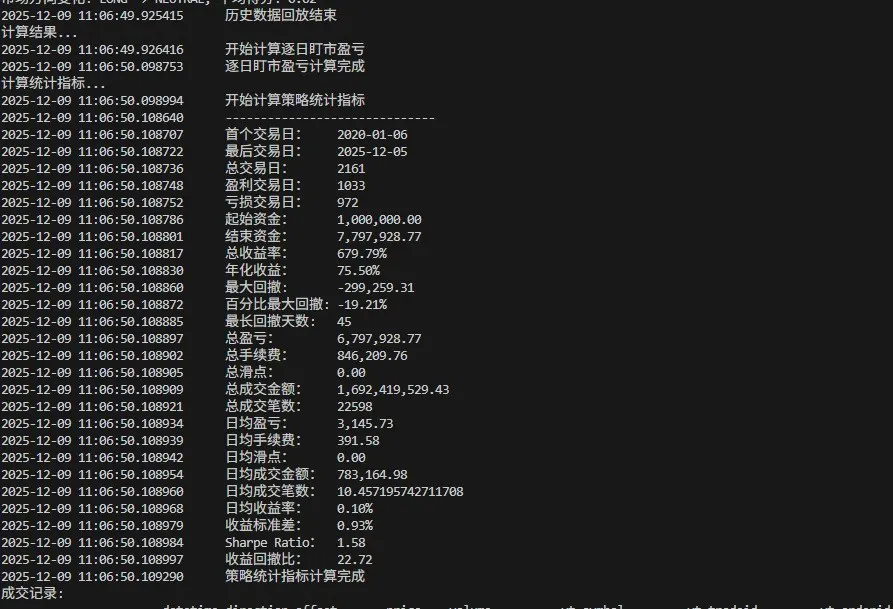
Before machine-learning, complete factor feature engineering via linear weighting: 22 Binance USDT-perpetual contracts, 2020–2025 six-year backtest — +679.79% return, 19.21% max drawdown, return/drawdown ratio 22.72, with year-by-year equity curves.
Before implementing a machine-learning model, feature engineering on the factors must come first. There are two approaches to combining factors — linear weighting and ML model fitting — and this report focuses on the linear weighting route. It places higher demands on the factors: once the key factor issues are resolved, the training efficiency of ML models improves significantly.
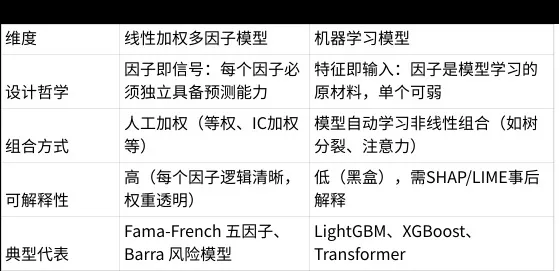
Linear Weighting vs. Machine Learning
In quantitative investing, linear-weighted multifactor models and ML models represent two distinct philosophies of factor handling and portfolio construction. Both aim at predicting asset returns, but differ fundamentally in methodology, applicable scenarios and risk characteristics:

Backtest Setup
- Instruments: research and backtesting on 22 Binance USDT-perpetual contracts.
- Fees & slippage: Binance charges 0.05‰ for market orders and 0.02‰ for limit orders; the system uses a periodic rollover model with limit orders only, so the average fee is 0.035‰. Assuming 0.015% slippage (sufficient under normal conditions), the backtest fee is set to 0.03% including slippage.
- Strategy settings: linear weighting → normalization required; long and short both traded — the long/short decision is based on the average value and all positions close on reversal; portfolio rebalanced every 12 hours.
- Backtest settings: January 1, 2020 – December 5, 2025; initial capital 10 million, allocated 10 million to each contract, leverage 20×; minimum trade size 0.01.
- ICIR report: to be added later.
Backtest Report
Over nearly 6 years: return 679.79%, maximum drawdown 19.21%, return-to-drawdown ratio 22.72, Sharpe ratio 1.58.
Annual Breakdown
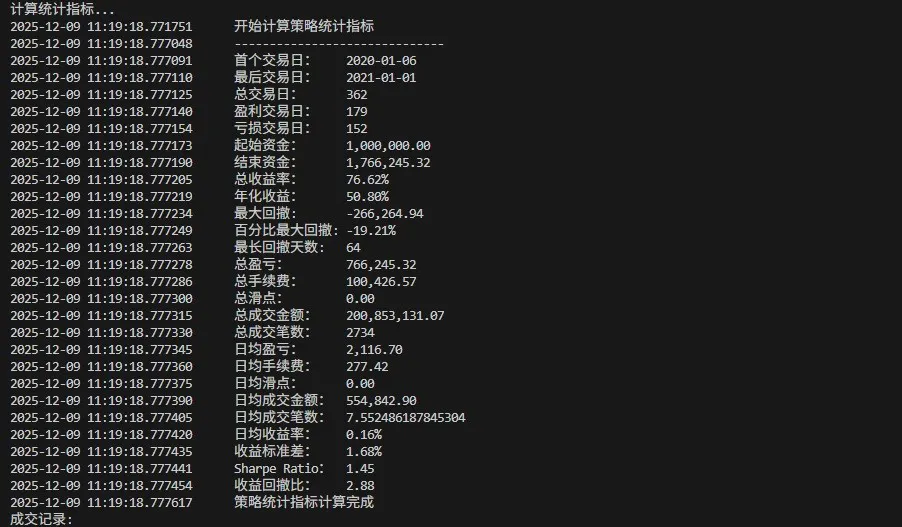
2020 — performance was average; return/drawdown 2.88:
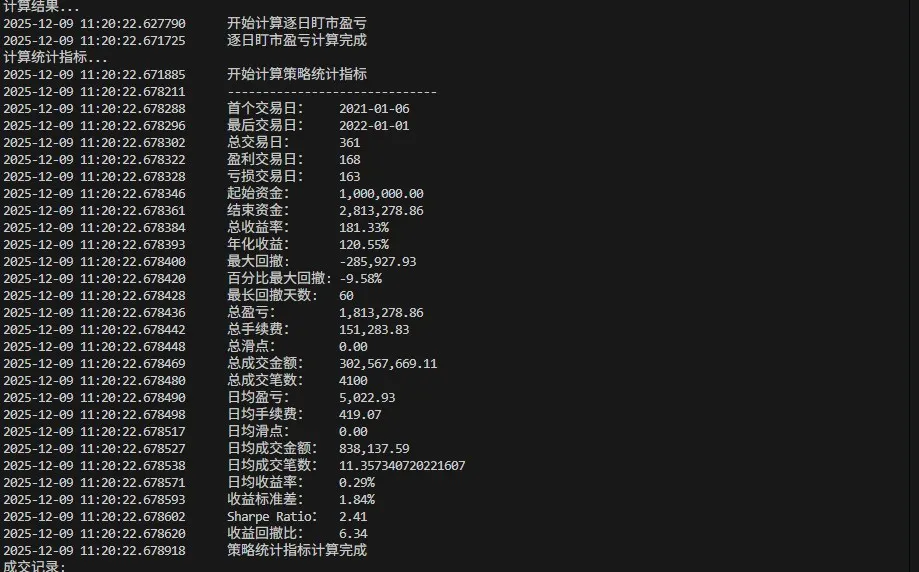
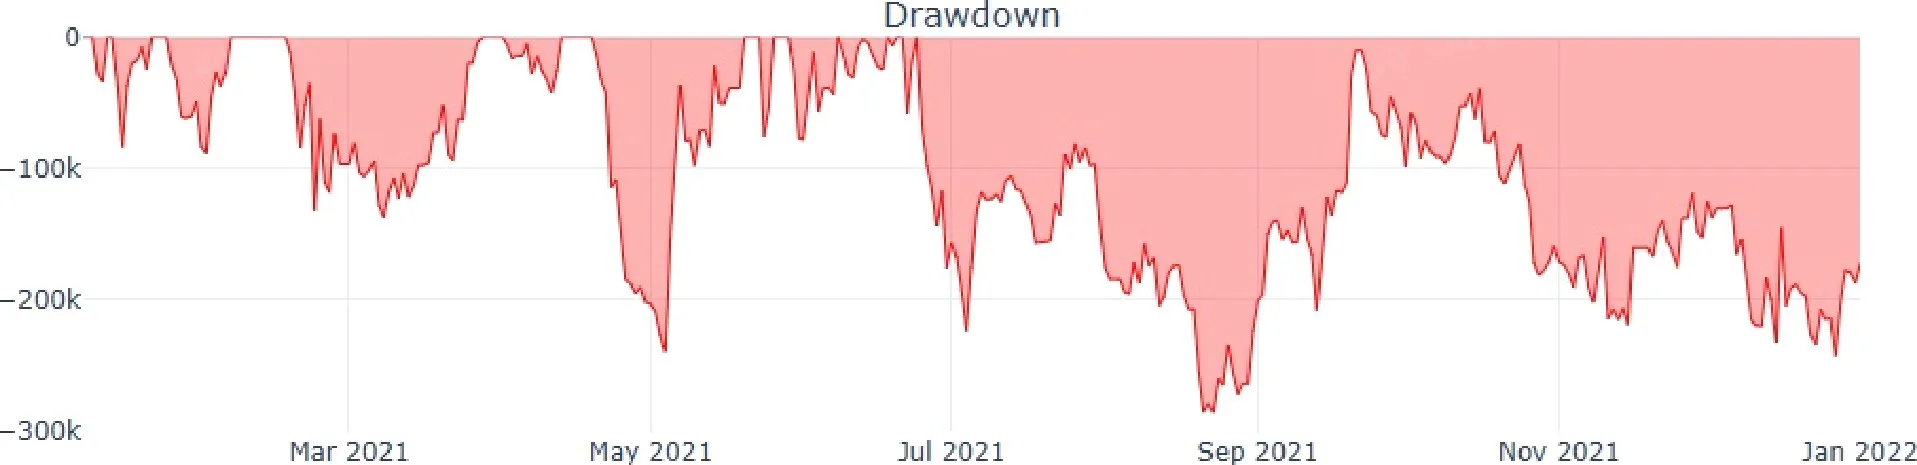
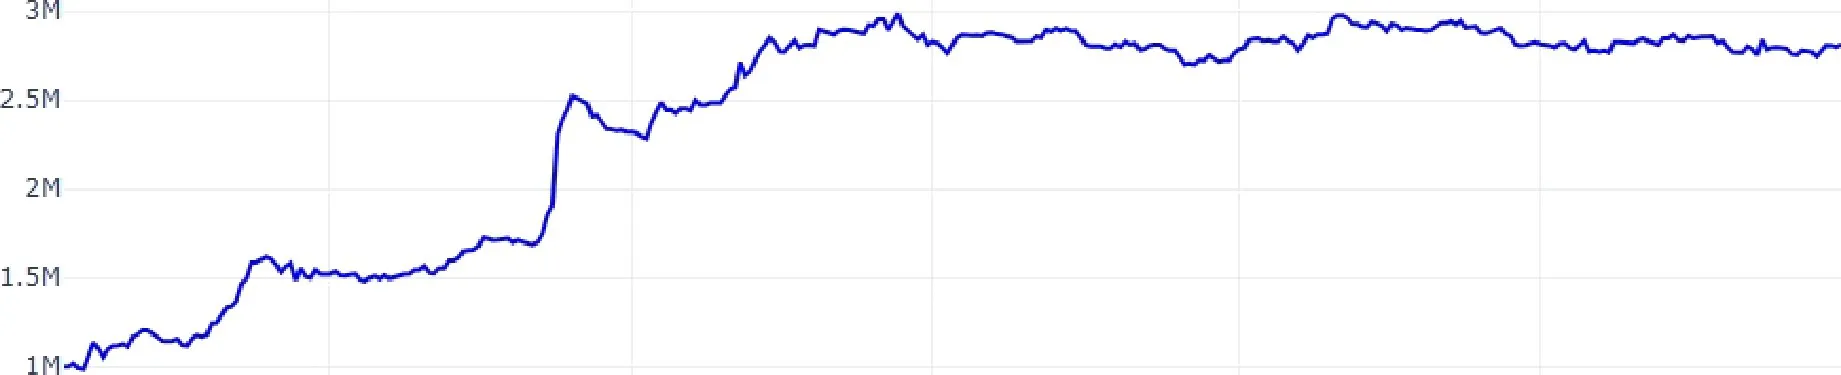
2021 — a strong year for gains; return/drawdown ratio 6.34:
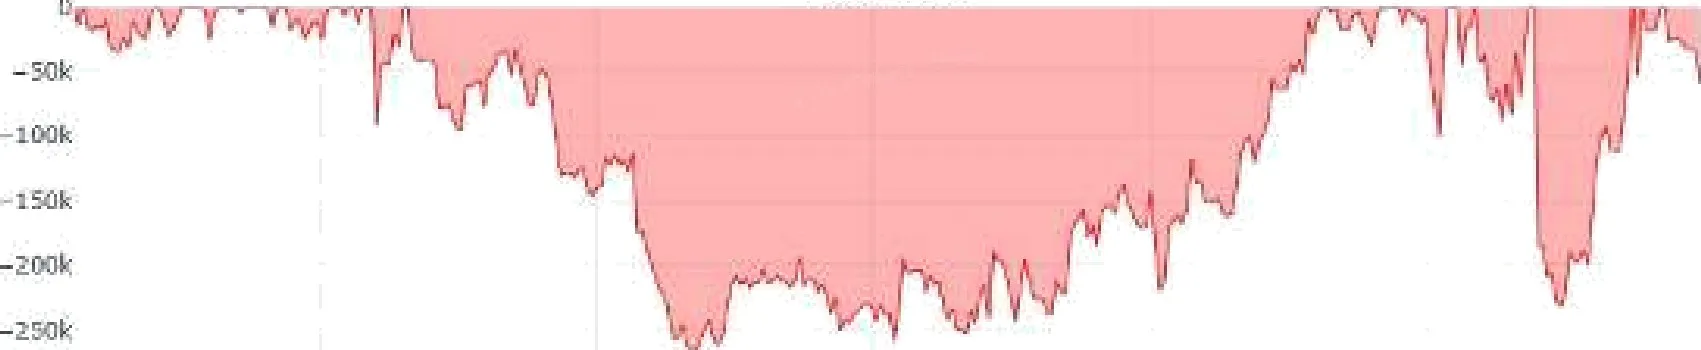

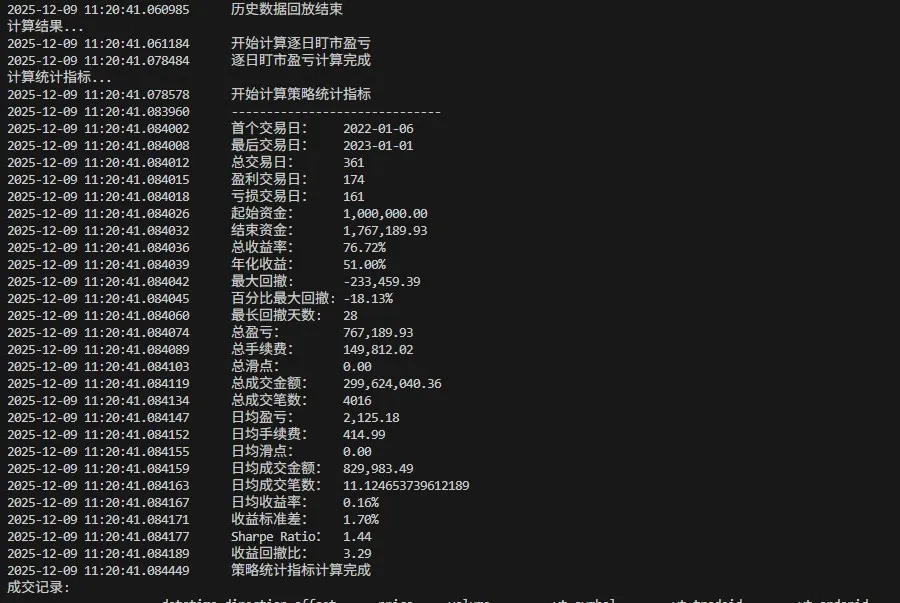
2022 — a year of sharp declines, but returns were still decent; drawdown ratio 3.29:
2023 — a year of rebound; drawdown 3.3%:
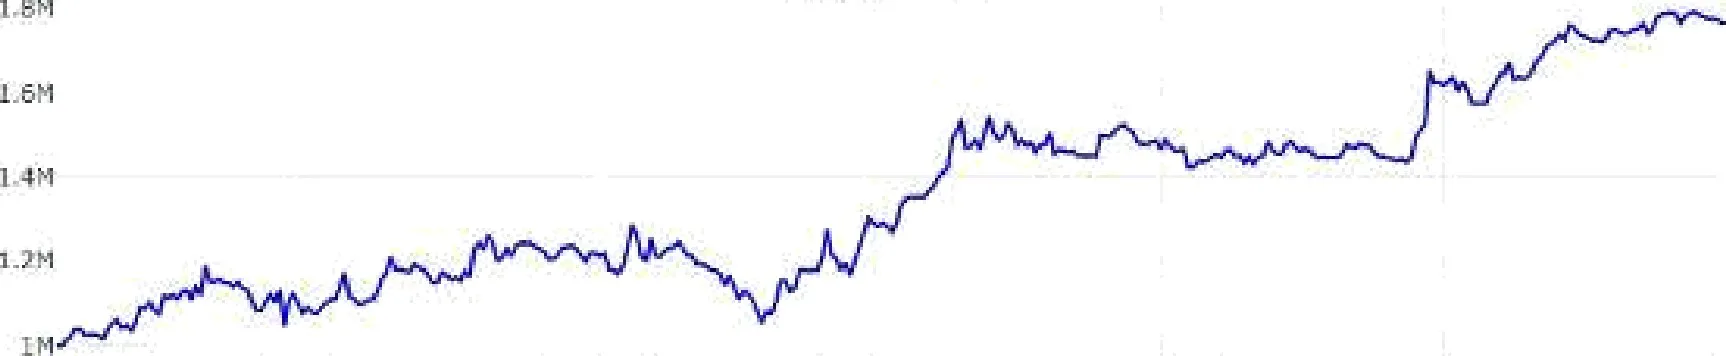
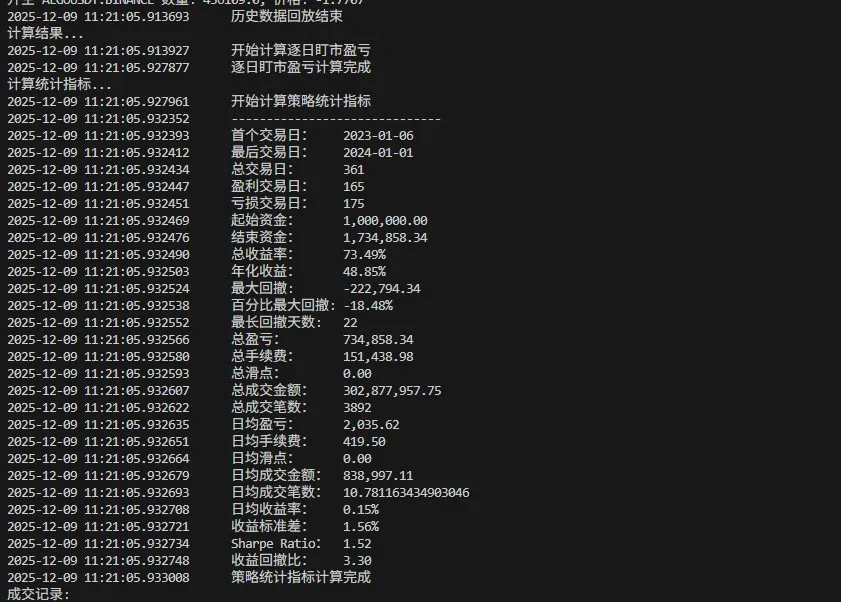
2024 — a year of new highs, with a drawdown of 8.49% — the highest in recent years:
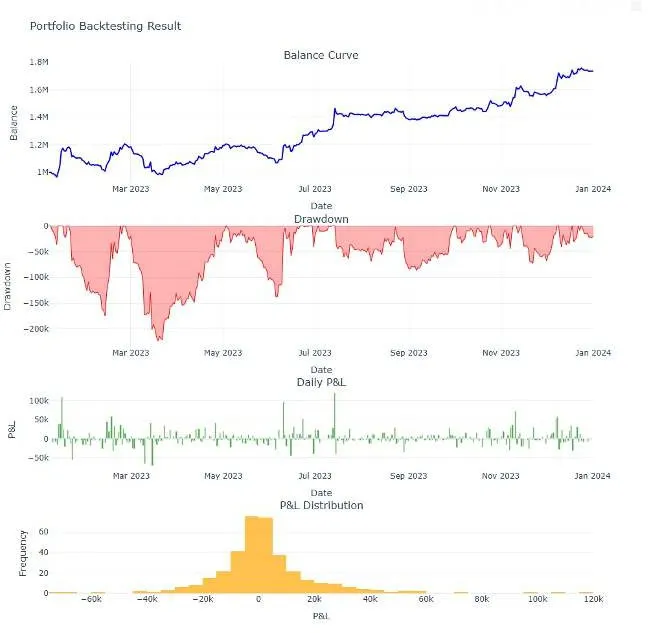
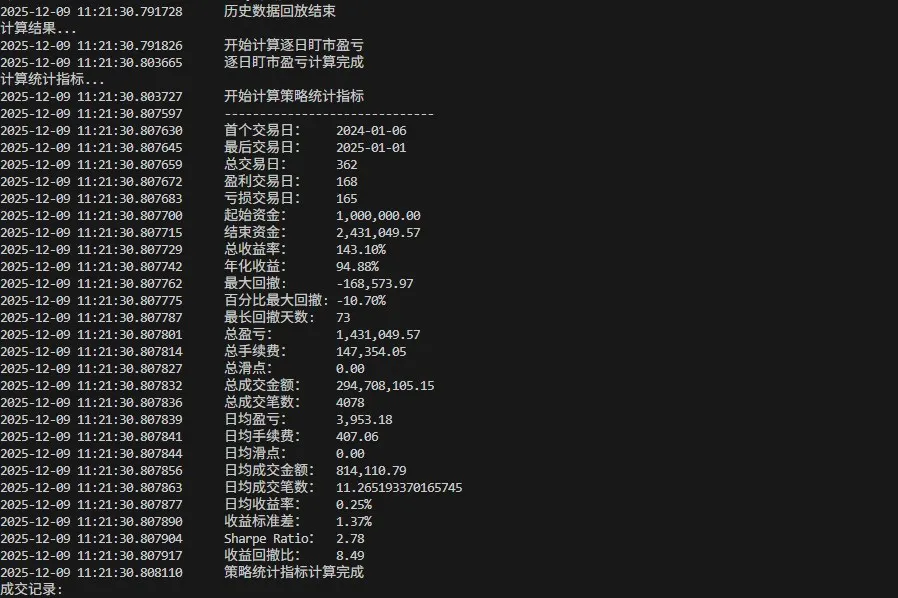
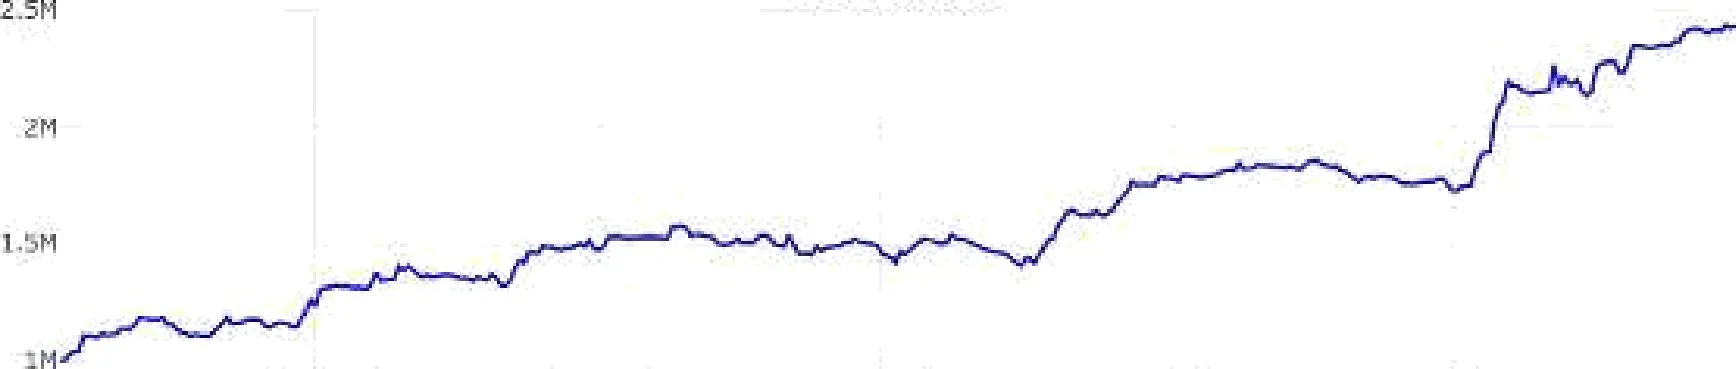
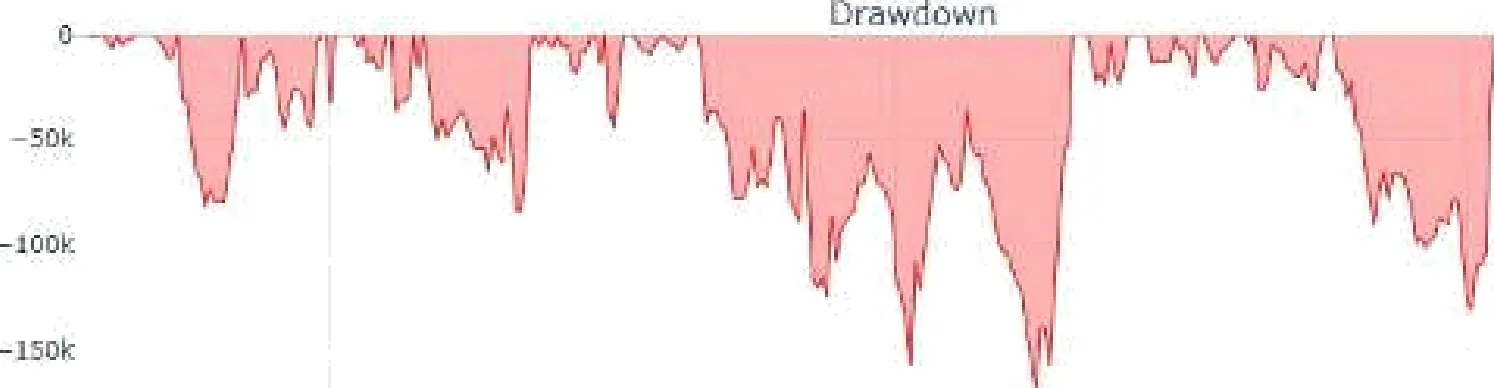
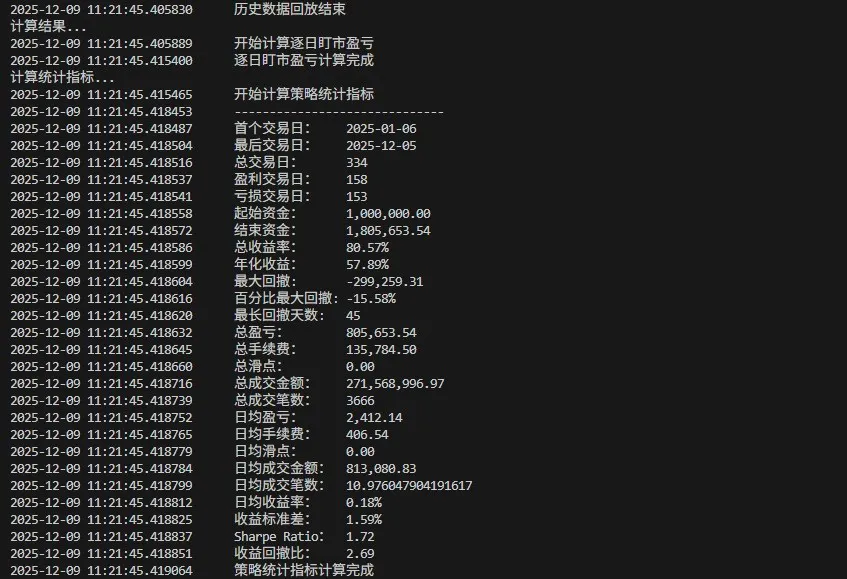
2025 — a lot of volatility with average returns; drawdown ratio 2.69:
Summary
Current returns are acceptable; the next step is to see whether better profits can be achieved in live trading. Going forward, research and training will move to machine learning — see the ML TopK portfolio backtest.
Backtest results are based on historical data and fixed fee/slippage assumptions and do not constitute investment advice.