News Sentiment Strategy: Complete Research Report
Complete research of the news sentiment factor: IC/ICIR verifies sentiment is a lagging indicator → contrarian strategy → news + volume dual filter → momentum re-optimization. 10-month HK/US backtest excess return +28.93% / +36.47%; HK + momentum lifts return/drawdown to 7.29.
Complete research report on the news sentiment factor. Date: April 20, 2026.
I. Research Starting Point: The Hypothesis of a Very Low ICIR
The initial news sentiment scores came from the ZR sentiment platform (Qwen3.5-2B SFT + FinBERT):
- Assign a sentiment score (0–100) to each news article;
- Time-decay-weighted aggregation + dual-threshold decision → BUY / NEUTRAL / SELL.
Initial hypothesis: news sentiment scores should lead price movements and predict future returns. Problem: used directly to predict future returns, the IC/ICIR is very low — even negative.
New hypothesis: sentiment scores are not a leading indicator but a lagging reflection of market movements — prices move first, news follows.
II. Hypothesis Validation: IC/ICIR Analysis
Using 196 trading days of U.S. stock data, correlations were computed between sentiment scores and both past and future returns:
| Factor | Horizon | Past-returns IC | Future-returns IC | Conclusion |
|---|---|---|---|---|
| Aggregate sentiment score | 1 day | +10.48% | -1.46% | News follows the market |
| Aggregate sentiment score | 2 days | +15.80% | -1.13% | News follows the market |
| Aggregate sentiment score | 5 days | +13.54% | -0.08% | News follows the market |
| Signal value | 1 day | +9.54% | -1.62% | News follows the market |
| Signal value | 2 days | +14.13% | -1.46% | News follows the market |
The past-2-day window is strongest: IC +15.80%, ICIR 2.08, positive-IC probability 97.4% — and virtually unrelated to future returns. Sentiment is a lagging indicator.
III. News Signal → Action
| News signal | Past price movement | Action |
|---|---|---|
| BUY (positive) | Hasn’t risen yet | Go long / close short |
| BUY (bullish) | Price has already risen | Close long |
| SELL (bearish) | Hasn’t fallen yet | Open short / close long |
| SELL (bearish) | Price has already fallen | Close short |
IV. News Coverage: U.S. Stocks vs. Hong Kong Stocks
| Indicator | U.S. stocks | Hong Kong stocks | Note |
|---|---|---|---|
| Stocks with daily news | 498 | 115 | US news frequency is 4.3× HK |
| Stocks traded daily | 4,697 | 2,197 | Market-cap gap between markets |
| Median days with news per stock | 5 | 7 | Approximately |
| Stocks covered in 7-day news | 2,157 | 621 | Coverage within window |
| 7-day news coverage rate | 44% | 23% | Coverage gap |
| Top-50 share of turnover | 40.2% | 54.4% | HK more concentrated |
| Top-200 share of turnover | 62.0% | 81.2% | HK more concentrated |
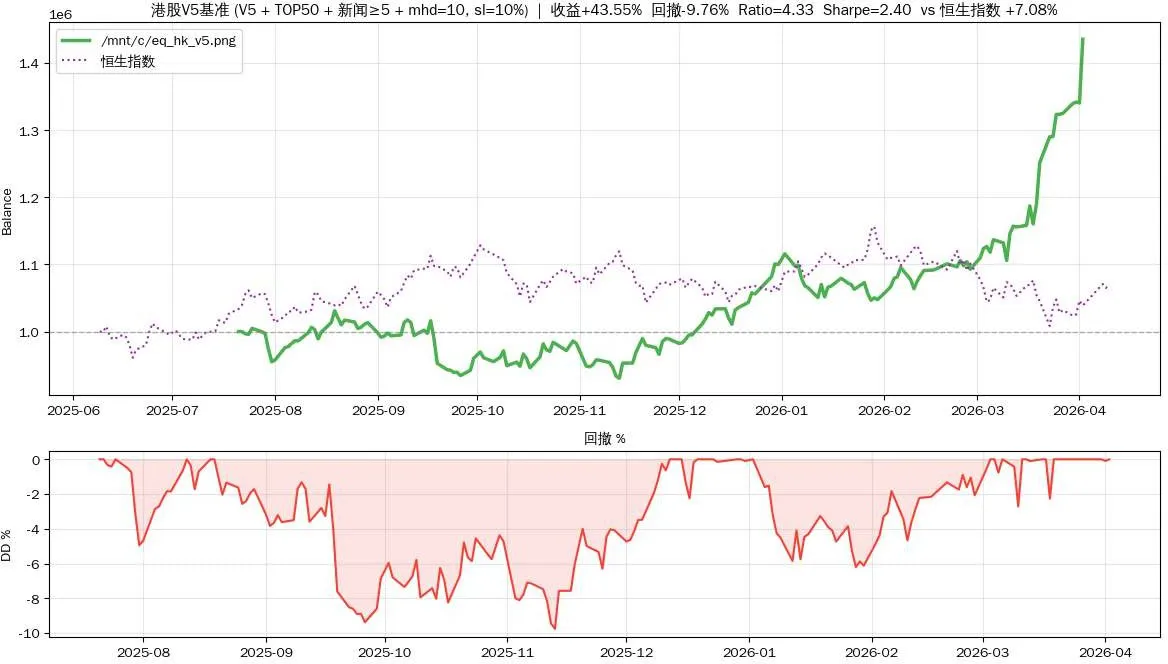
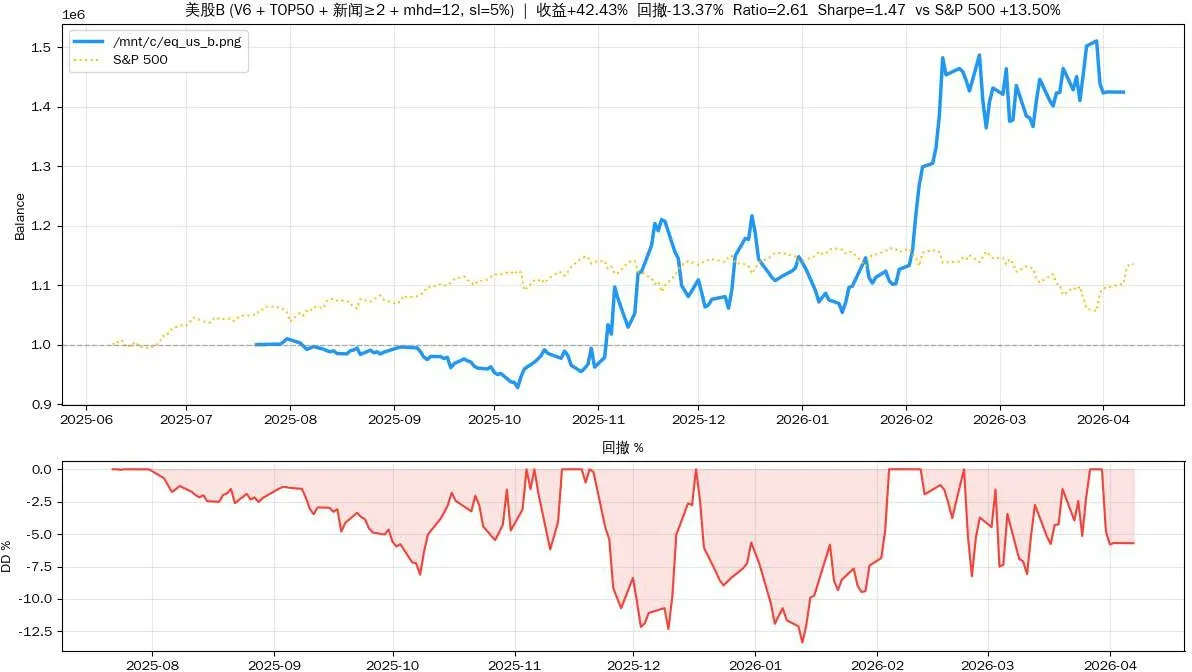
Key finding: news has predictive power only when stock liquidity and news volume both stay above a threshold —
- Illiquid stocks react sluggishly even to news, so contrarian signals fail;
- With sparse news volume, signals are too rare to trigger consistently;
- Only the intersection of both screens yields strong signals: lenient news criteria (≥ 2 days) for U.S. stocks, strict criteria (≥ 5 days) for Hong Kong stocks.
V. Further Optimization: Adding a Momentum Factor
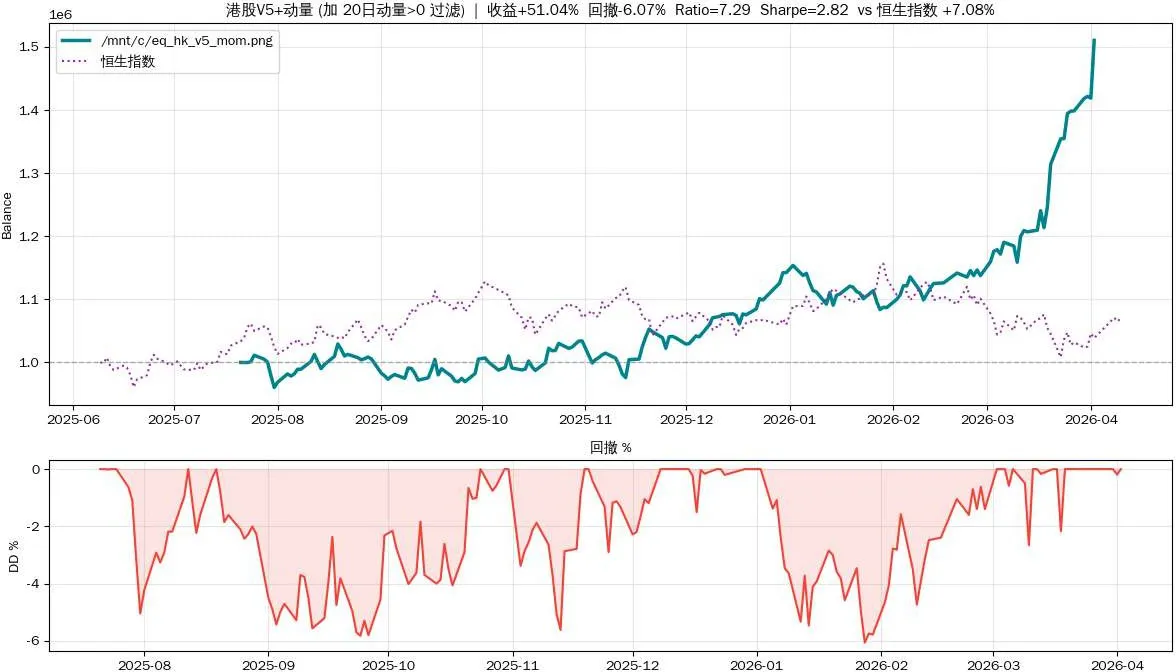
The “oversold rebound” leg (SELL + already down → go long) in the Hong Kong strategy tends to catch a falling knife in major downtrends. A momentum filter restricts rebounds to pullbacks within uptrends.
| Dimension | HK V5 baseline | HK V5 + momentum | Change |
|---|---|---|---|
| Pool | 21 | 15 | More curated |
| Return | +43.55% | +51.04% | +17% |
| Drawdown | -9.76% | -6.07% | Improved 33% |
| Return/drawdown | 4.33 | 7.29 | +68% |
| Sharpe | 2.40 | 2.82 | +17% |
| Trades | 172 | 104 | -40%, more stable |
U.S. stocks with momentum actually underperformed: +42.43% / -13.37% (ratio 2.61) → +37.12% / -17.32% (ratio 1.73). Reason: HK (V5) kept the oversold rebound, so momentum only prevents falling knives; U.S. (V6) had oversold rebound disabled (skip_rebound=True), so the momentum filter just narrows the valid-signal pool.
VI. Final Optimal Solutions
| Market | Return | Drawdown | Ratio | Sharpe | Excess vs. market |
|---|---|---|---|---|---|
| U.S. stocks | +42.43% | -13.37% | 2.61 | 1.47 | +28.93% |
| Hong Kong stocks | +43.55% | -9.76% | 4.33 | 2.40 | +36.47% |
| Hong Kong + momentum | +51.04% | -6.07% | 7.29 | 2.82 | +43.96% |
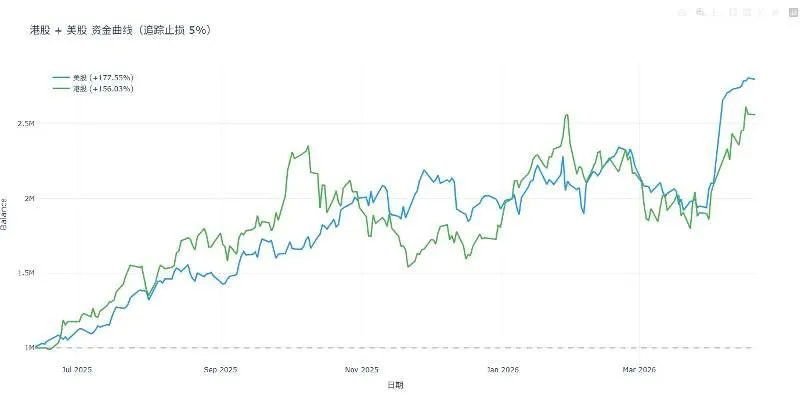
VII. Key Conclusions
- Sentiment is a lagging indicator (IC-verified): the sentiment–return IC over the past 2 days is +15.80% (ICIR 2.08, 97.4% positive), and virtually unrelated to future returns.
- Contrarian strategies are effective: built on sentiment lag, contrarian trading significantly outperformed both markets.
- News + volume must be screened together: neither dimension alone suffices; only the intersection ensures signal strength.
- Lenient news criteria (≥ 2 days) for U.S. stocks, strict (≥ 5 days) for Hong Kong stocks — reflecting the news-density difference between the two markets.
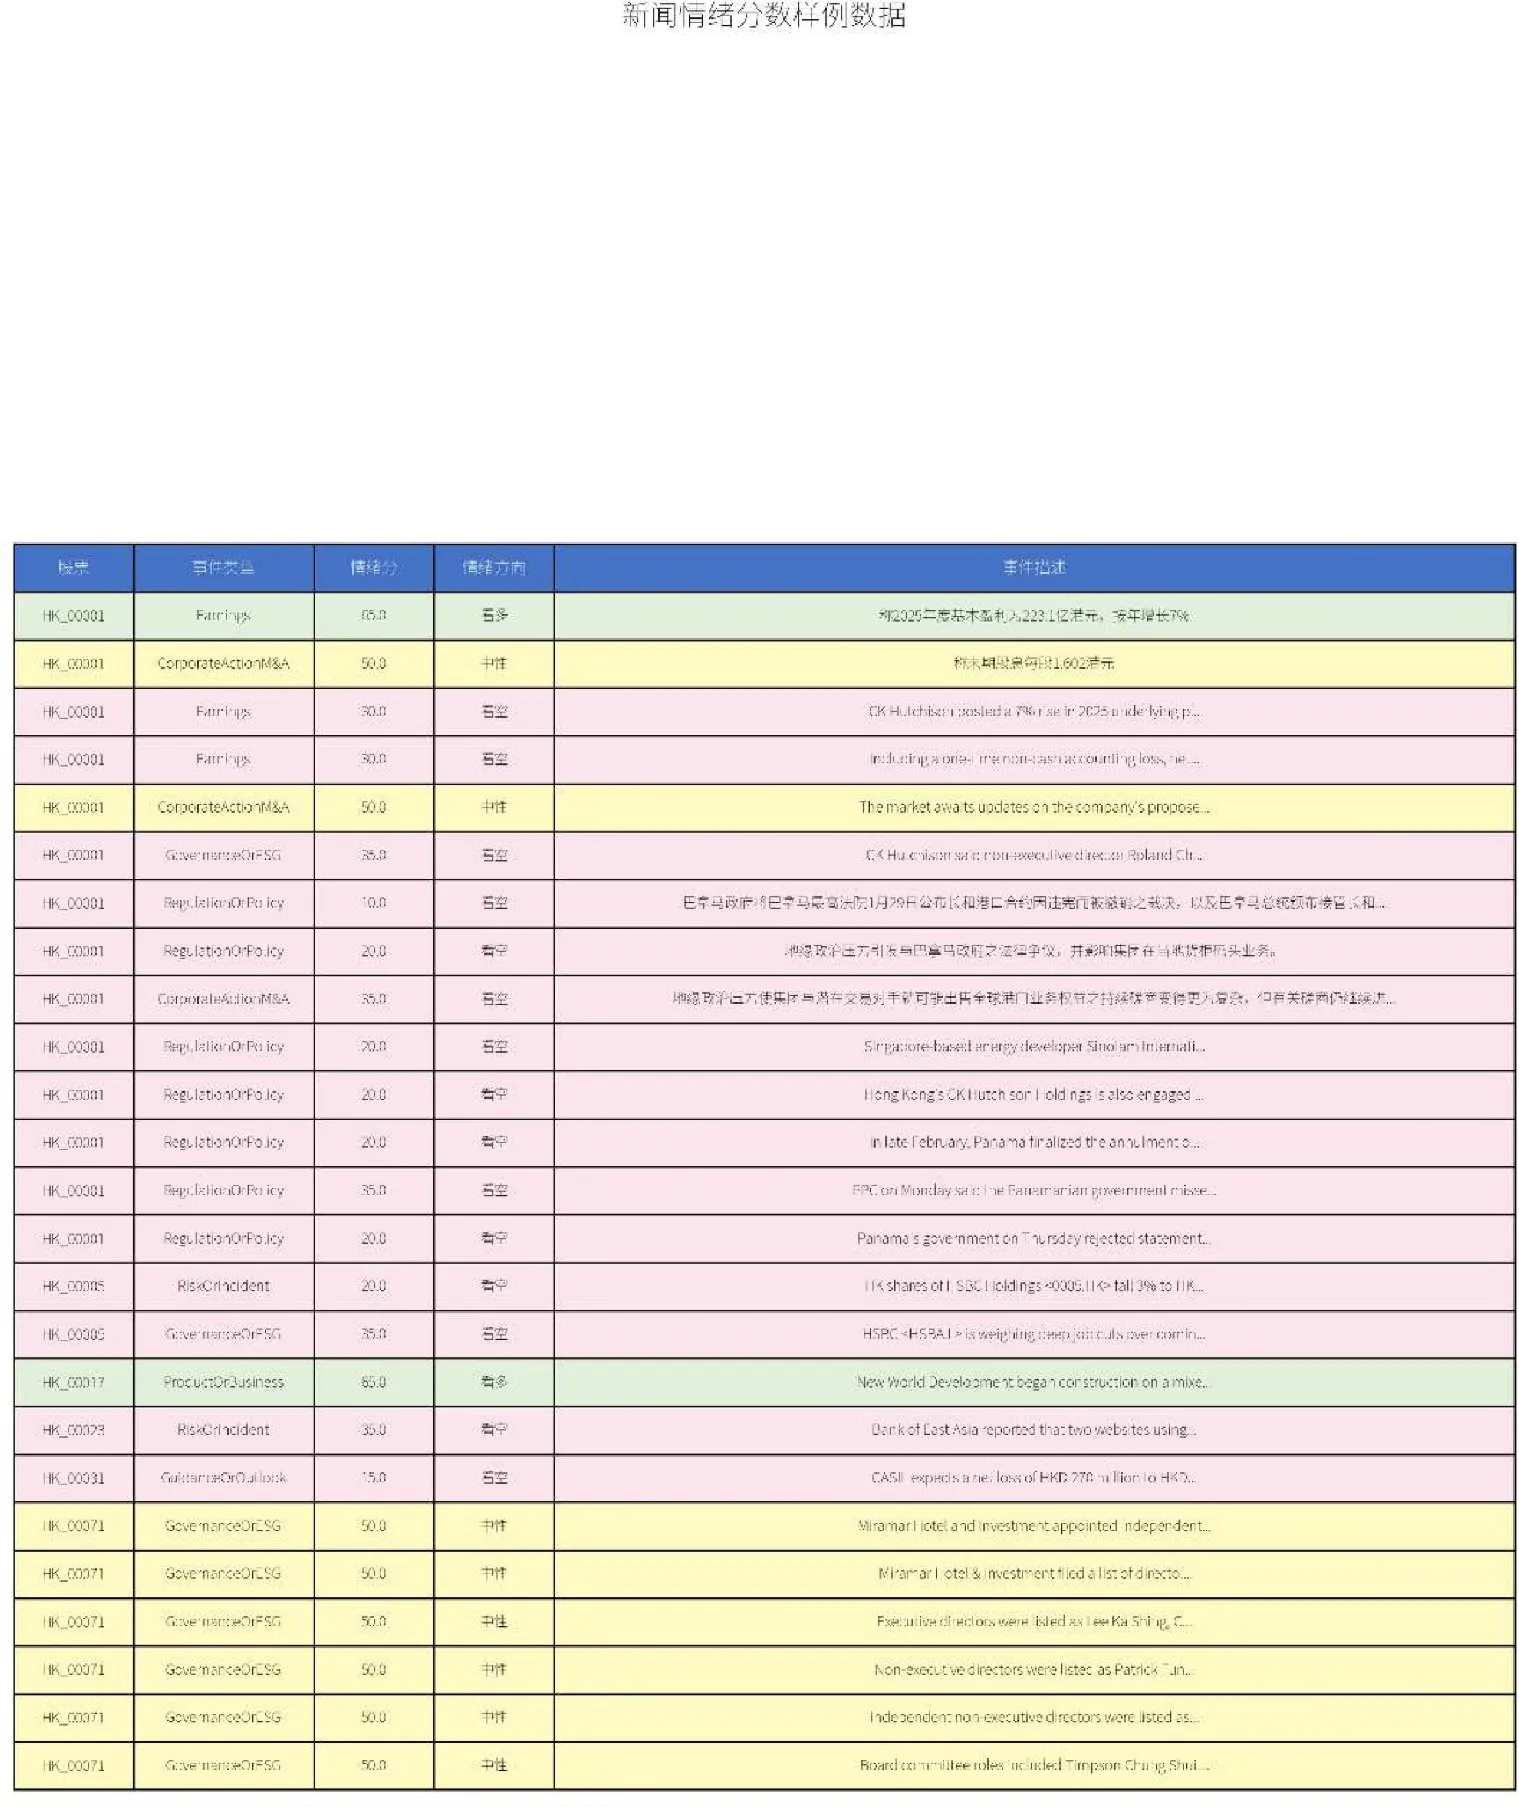
Appendix: Sample Sentiment Data
Backtest results are based on historical data and fixed fee/slippage assumptions and do not constitute investment advice.