⚠ 本文为英文原文,暂无中文版。
All-Weather Product Selection + Timing Strategy Report (2024-01)
56 commodity futures tested at a strict 0.06% of contract value: top-20% indicator rotation timing — 8-year profit 38.7M, max drawdown 1.34M, return/drawdown 28.88; adding stock indices (IF/IM/IC) lifts the portfolio's 8-year return/drawdown ratio to 35.72.
All-weather product selection + timing strategy report, January 23, 2024.
I. Product Testing Report
- Based on 1 tick per trade and higher transaction fees, trading cost is approximately 0.05% of contract value; for testing we use a deliberately stricter standard — 0.06% of contract value.
- 56 products were tested with the following results:
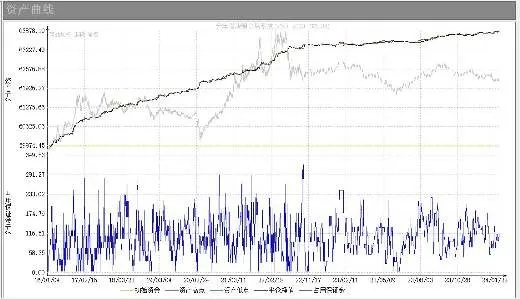
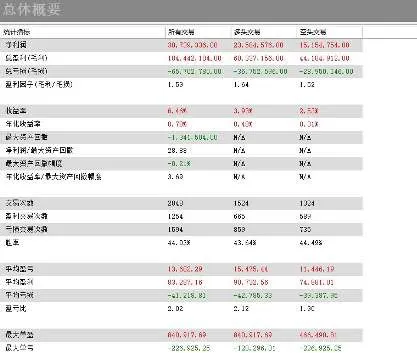
The strategy rotates into the top 20% of securities by indicator at regular intervals. Total margin required is 3.5 million, corresponding to a typical position value of 35 million. Over the past 8 years: profit 38.7 million, maximum drawdown 1.34 million, profit-to-drawdown ratio 28.88; annualized return/drawdown ratio 3.6.
II. Commodity + Stock Index Portfolio
Adds CSI 300 (IF), CSI 1000 (IM) and CSI 500 (IC) index strategies:
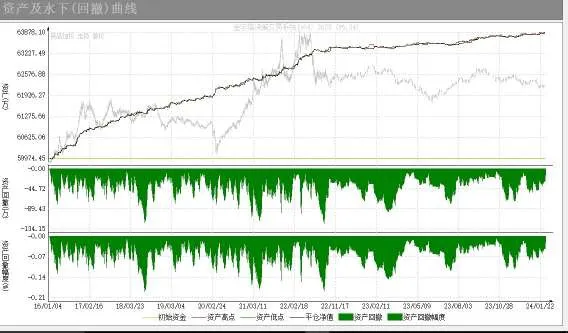
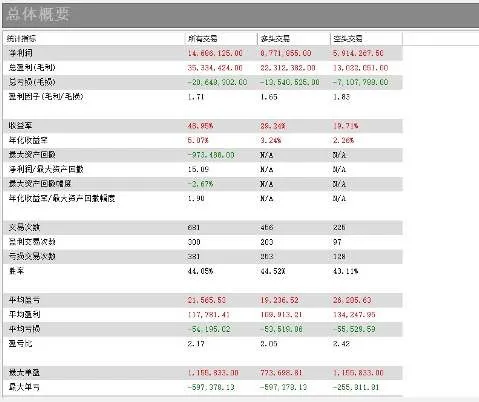
Overall portfolio:
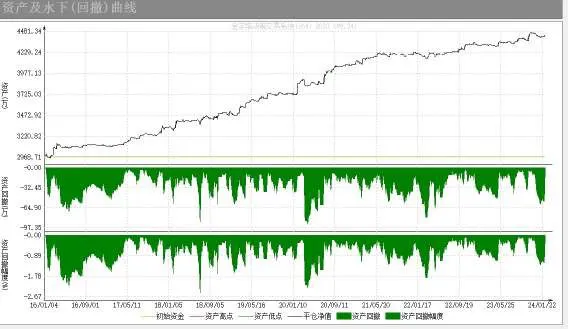
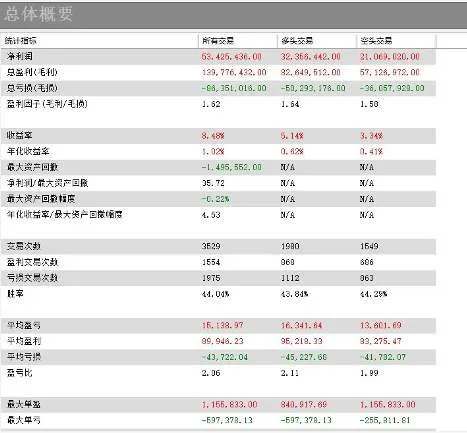
The 8-year return-to-drawdown ratio is 35.72, with an average annual return/drawdown ratio of about 4.5. Margin requirements and drawdowns have remained stable over the 8 years; the past year was the most favorable.
III. Summary
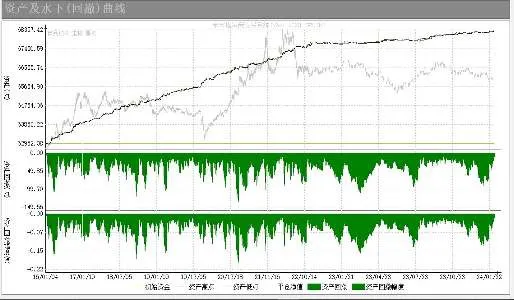
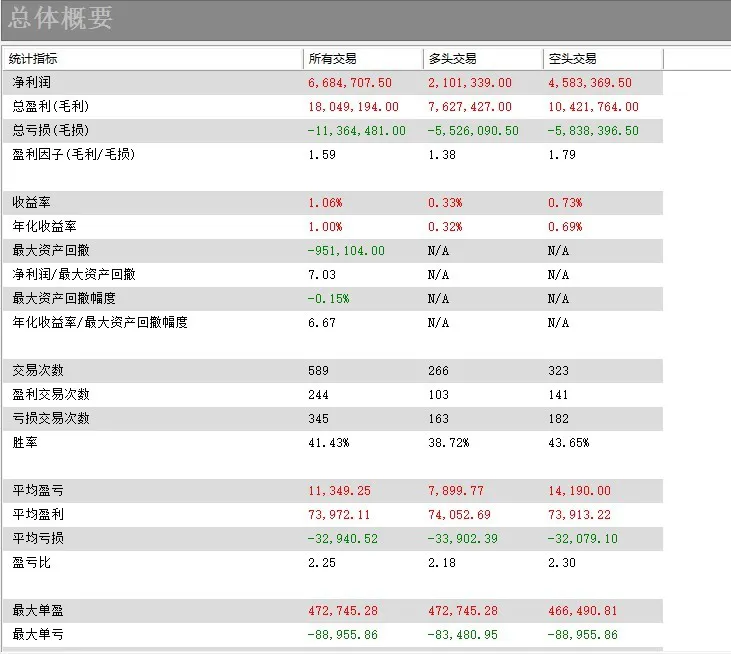
For accounts managed with a 10% stop-loss limit, the strategy is configured with an 8% drawdown. The annual return/drawdown ratio is about 4.4 or higher, producing an annualized return of roughly 35% with a maximum drawdown of around 8%. Last year was particularly favorable at 56%. Typical margin requirement is 28% of principal; the historical maximum has been 40% of principal — reasonable figures indicating relatively stable profitability.
IV. Live Trading Data
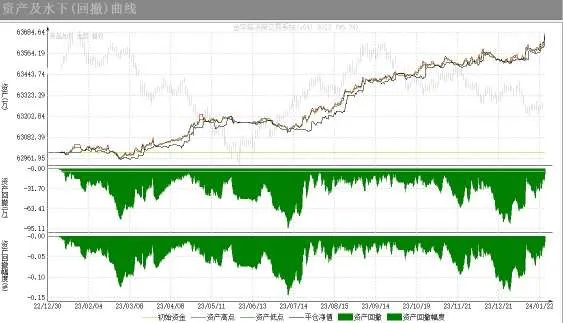
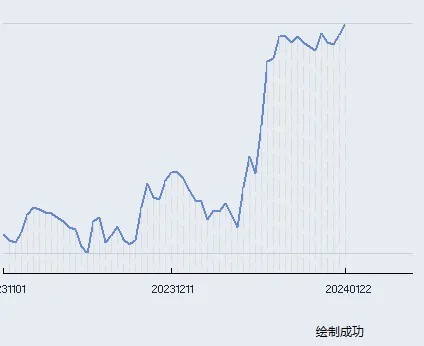
Live trading has been running for less than three months; see the live track record section for ongoing records.
Historical report. Past performance does not guarantee future results; not investment advice.