⚠ 本文为英文原文,暂无中文版。
Equity Multi-Factor Model Strategy Report (2023-06)
Equity multi-factor model on Guoren.com: +1,776% compounded since 2010 with a 40.33% max drawdown, beta attribution vs. CSI 300; volume/volatility factor IC analysis (positive-IC probability 67% / 61%) and factor correlation tests.
Equity multi-factor model strategy report, June 20, 2023.
I. Strategy Overview
The “Zhi Mian” strategy has always been based on market timing — a passive-style tracking strategy. Most quantitative stock strategies today, however, are multi-factor strategies primarily seeking alpha or beta returns.
Following the Zhi Mian philosophy, this report attempts a multi-factor stock strategy focused on beta returns (alpha has become increasingly hard to generate and identify in recent years). Multi-factor models generally follow a fixed pattern: stock selection — rebalancing cycle — market-trend filtering — index hedging (for pure alpha). Platforms such as JuKuan, YouKuang and MiKuang all offer multi-factor tools; guided by simplicity and effectiveness, Guoren.com was chosen as the development platform. Returns on Guoren are compounded — each rebalance reinvests principal plus returns — which matters when annualizing.
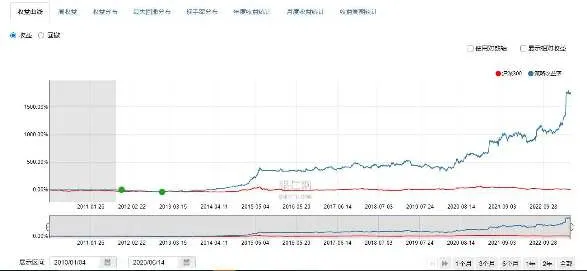
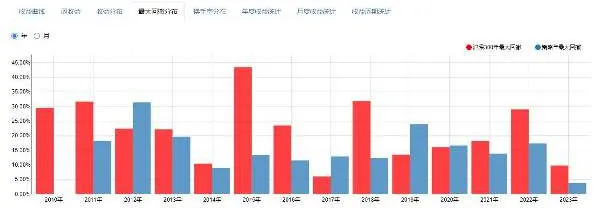
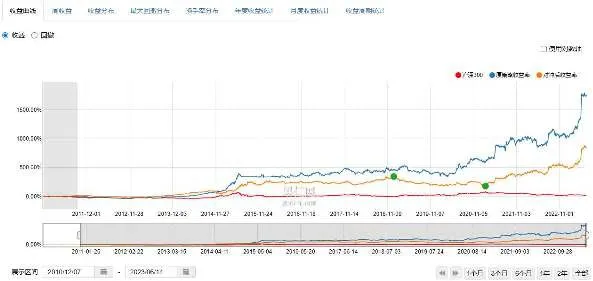
Calculated from compound return, the return since 2010 is 1,776% with a maximum drawdown of 40.33%. The longest streak of new highs was 537 days, in 2012.
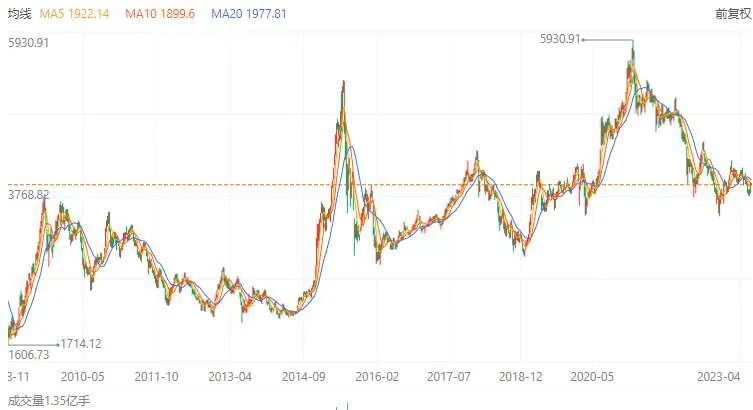
Only 2014–2015 saw significant market movement; the market consolidated until end-2019, with some returns starting 2020. Individually, 2011, 2012, 2016 and 2019 posted negative returns — comparing against CSI 300 shows the negative years coincide with extreme index volatility. This strategy is a modified market-timing strategy, better suited to smaller market swings, which is also why it still generated returns in recent years.
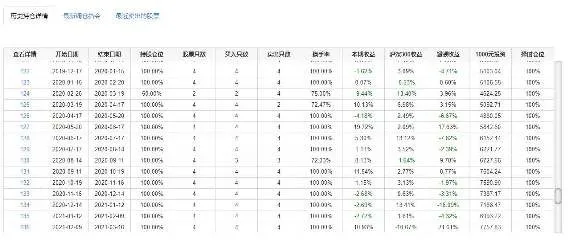
Multi-factor strategies, due to periodic rebalancing, tend to realize maximum drawdowns during holding periods; and being either fully invested or uninvested, sustained market declines are hard to avoid even for beta-tracking factors. The factor philosophy assumes factors eventually deliver excess returns, so the strategy runs at full capacity by default. Multi-factor approaches are therefore better suited to alpha-oriented mandates; this report deliberately targets beta first.
II. Strategy Principles and Analysis
The factors are mainly independent variables borrowed from stock-timing strategies — trading volume and volatility — appropriately modified; the factor count is intentionally small. Portfolio stocks are also screened for strong expectations, referencing sell-side research with primarily fundamental criteria such as dividend yield and price-to-book.
Trading Volume Factor — IC Analysis
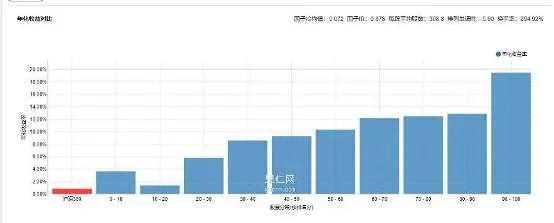
IC (Information Coefficient) is the cross-sectional correlation between a stock’s factor value and its next-period return. The volume–return correlation shows a monotonic trend: returns in the 10–20 rating groups are relatively low, while the 90–100 groups far exceed other groups. Positive-IC probability 67% (within the 60–70% band); IC and IR both demonstrate strong stability; IC also correlates with market capitalization.
Volatility Factor — IC Analysis
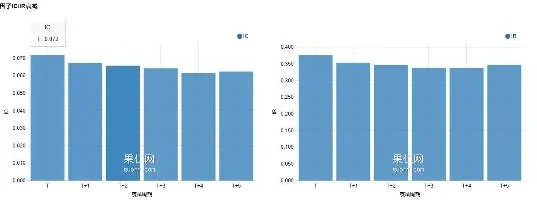
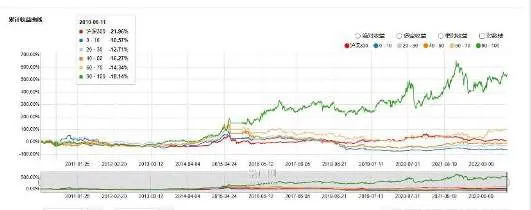
A correlation between volatility and returns exists, but returns in the lower groups (0–60) are too low — a relatively unstable factor with room for improvement. Most returns concentrate in the 90–100 group. Positive-IC probability 61% — not particularly high; IC and IR show clear cyclical decay; a reasonably stable relationship with market capitalization remains.
Factor Correlation
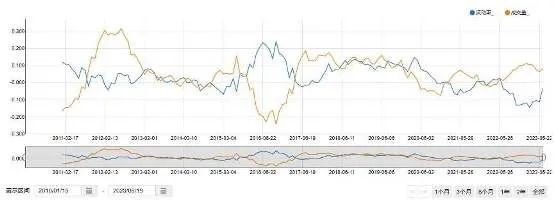
The two factors come from different data sources: their correlation is very weak — even negative — demonstrating no overlap in their explanatory ranges, while each keeps a certain correlation with returns.
Since this analysis targets beta only (not alpha), no t-test is required. With few factors, weights were simply set 1:1.
III. Summary
The return reached 1,776% with a 40% maximum drawdown, but the single-month drawdown was excessive and returns were overly concentrated in 2014, 2015 and 2020 — years where beta dominated and alpha was minimal. Recent returns have been solid, showing current conditions suit periodically rebalancing a stock portfolio to capture short-term trends. The rotation within the multi-factor stock strategy will continue to be refined in the search for both beta and alpha.
Historical report. Past performance does not guarantee future results; not investment advice.