⚠ 本文为英文原文,暂无中文版。
Stock Selection + Timing Strategy Report (2023-06)
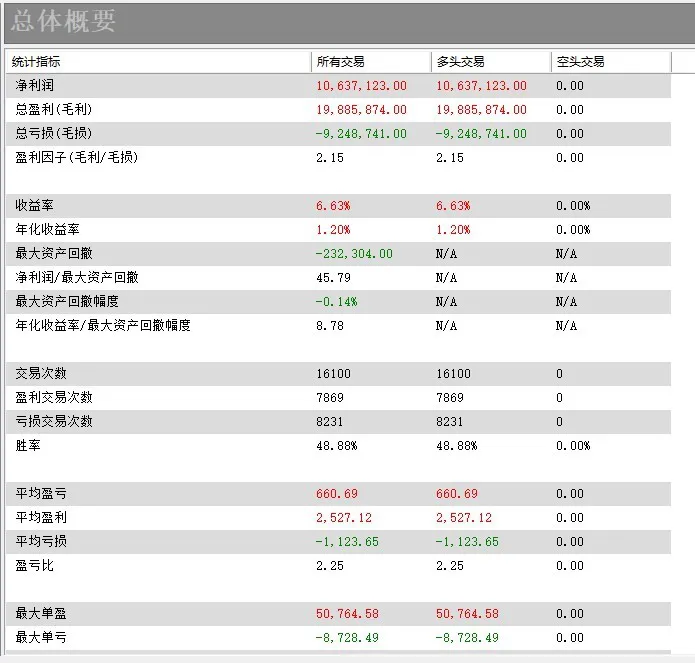
Stock selection + timing on 2,959 A-shares at a strict 1.5‰ one-way cost: 5.5-year profit 10.6379M, max drawdown 232k, return/drawdown ratio 45.79; on actually occupied capital of 10.4M — annualized return 18.6%, max drawdown rate 2.2%.
Stock selection + timing strategy report, June 12, 2023.
I. Test Report
Commissions: a one-way fee of 1.5‰ of transaction value covers both commission and slippage (standard commission 0.01‰ with a 5-yuan minimum; with slippage factored in, 1.5‰ one-way is adequate coverage).
Method: the strategy selects the top-rated stocks (top 20% by indicator) at regular intervals and executes trades based on market timing.
Setup: 2,959 stocks tested, 1.5‰ one-way commission, 50,000 allocated per stock; testing from January 2018:
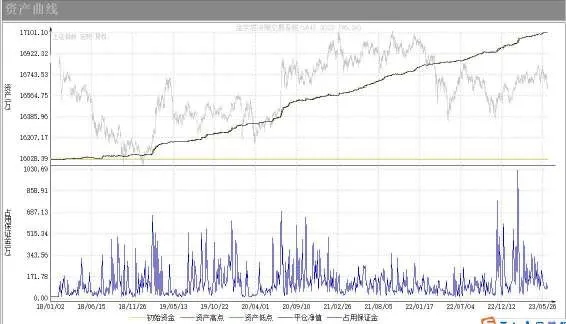
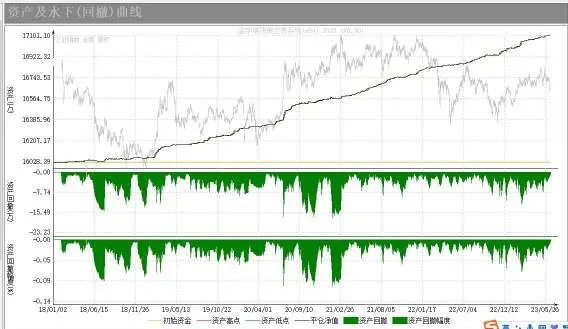
Key Numbers
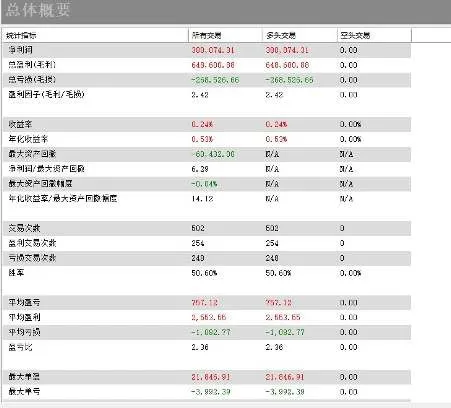
- Actual maximum capital utilized was 10.4 million, with daily capital typically around 7 million. Since January 2018: profit 10.6379 million, maximum drawdown 232,000, profit/drawdown ratio 45.79, trades 16,100 (win rate 48.88% = 7,869 / 16,100; profit factor 2.15 = 19,885,874 / 9,248,741).
- Over the 5.5-year test, average annual profit ≈ 1.934 million against a 232,000 drawdown; historical maximum capital utilization was 35% of theoretical capital; annualized return/drawdown ratio 8.3. On 10.4 million principal: return on investment 18.6%, maximum drawdown rate 2.2%.
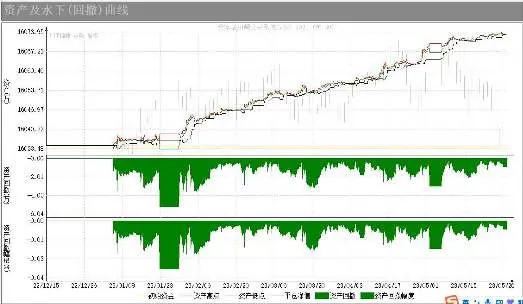
- Maximum drawdown occurred in January 2023 with a fairly quick recovery; the longest drawdown duration was 53 days — an area for improvement:
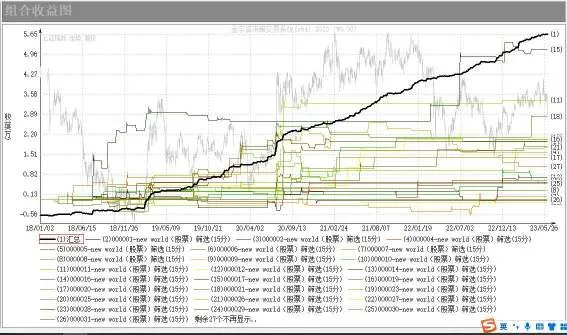
- This year’s performance: profit ≈ 380,000, return/drawdown ratio 6; capital utilization 224 (configurable cap); historical maximum utilization 35% of theoretical. Run-up period about 6 months, return/drawdown ratio 6.3. (No data January 23–30 due to the Spring Festival holiday.) On 10.4 million principal: year-to-date return 3.6%, maximum drawdown 0.5%.
II. Risk Management
- Strategy risk control: market strategies inevitably decay over time, primarily because their independent variables stop being stable. Example: in 2022 the CTA inventory strategy failed because inventory levels were no longer normal — both supply and demand fell, breaking the strong inventory–price correlation. Independent variables must therefore be monitored regularly.
- Economic-cycle management: investments would only be suspended in a scenario with historical precedent of extreme systemic stress.
III. Summary
Overall, annual returns typically amount to about 12% of principal with a maximum drawdown of around 2%.
Historical report. Past performance does not guarantee future results; not investment advice.